

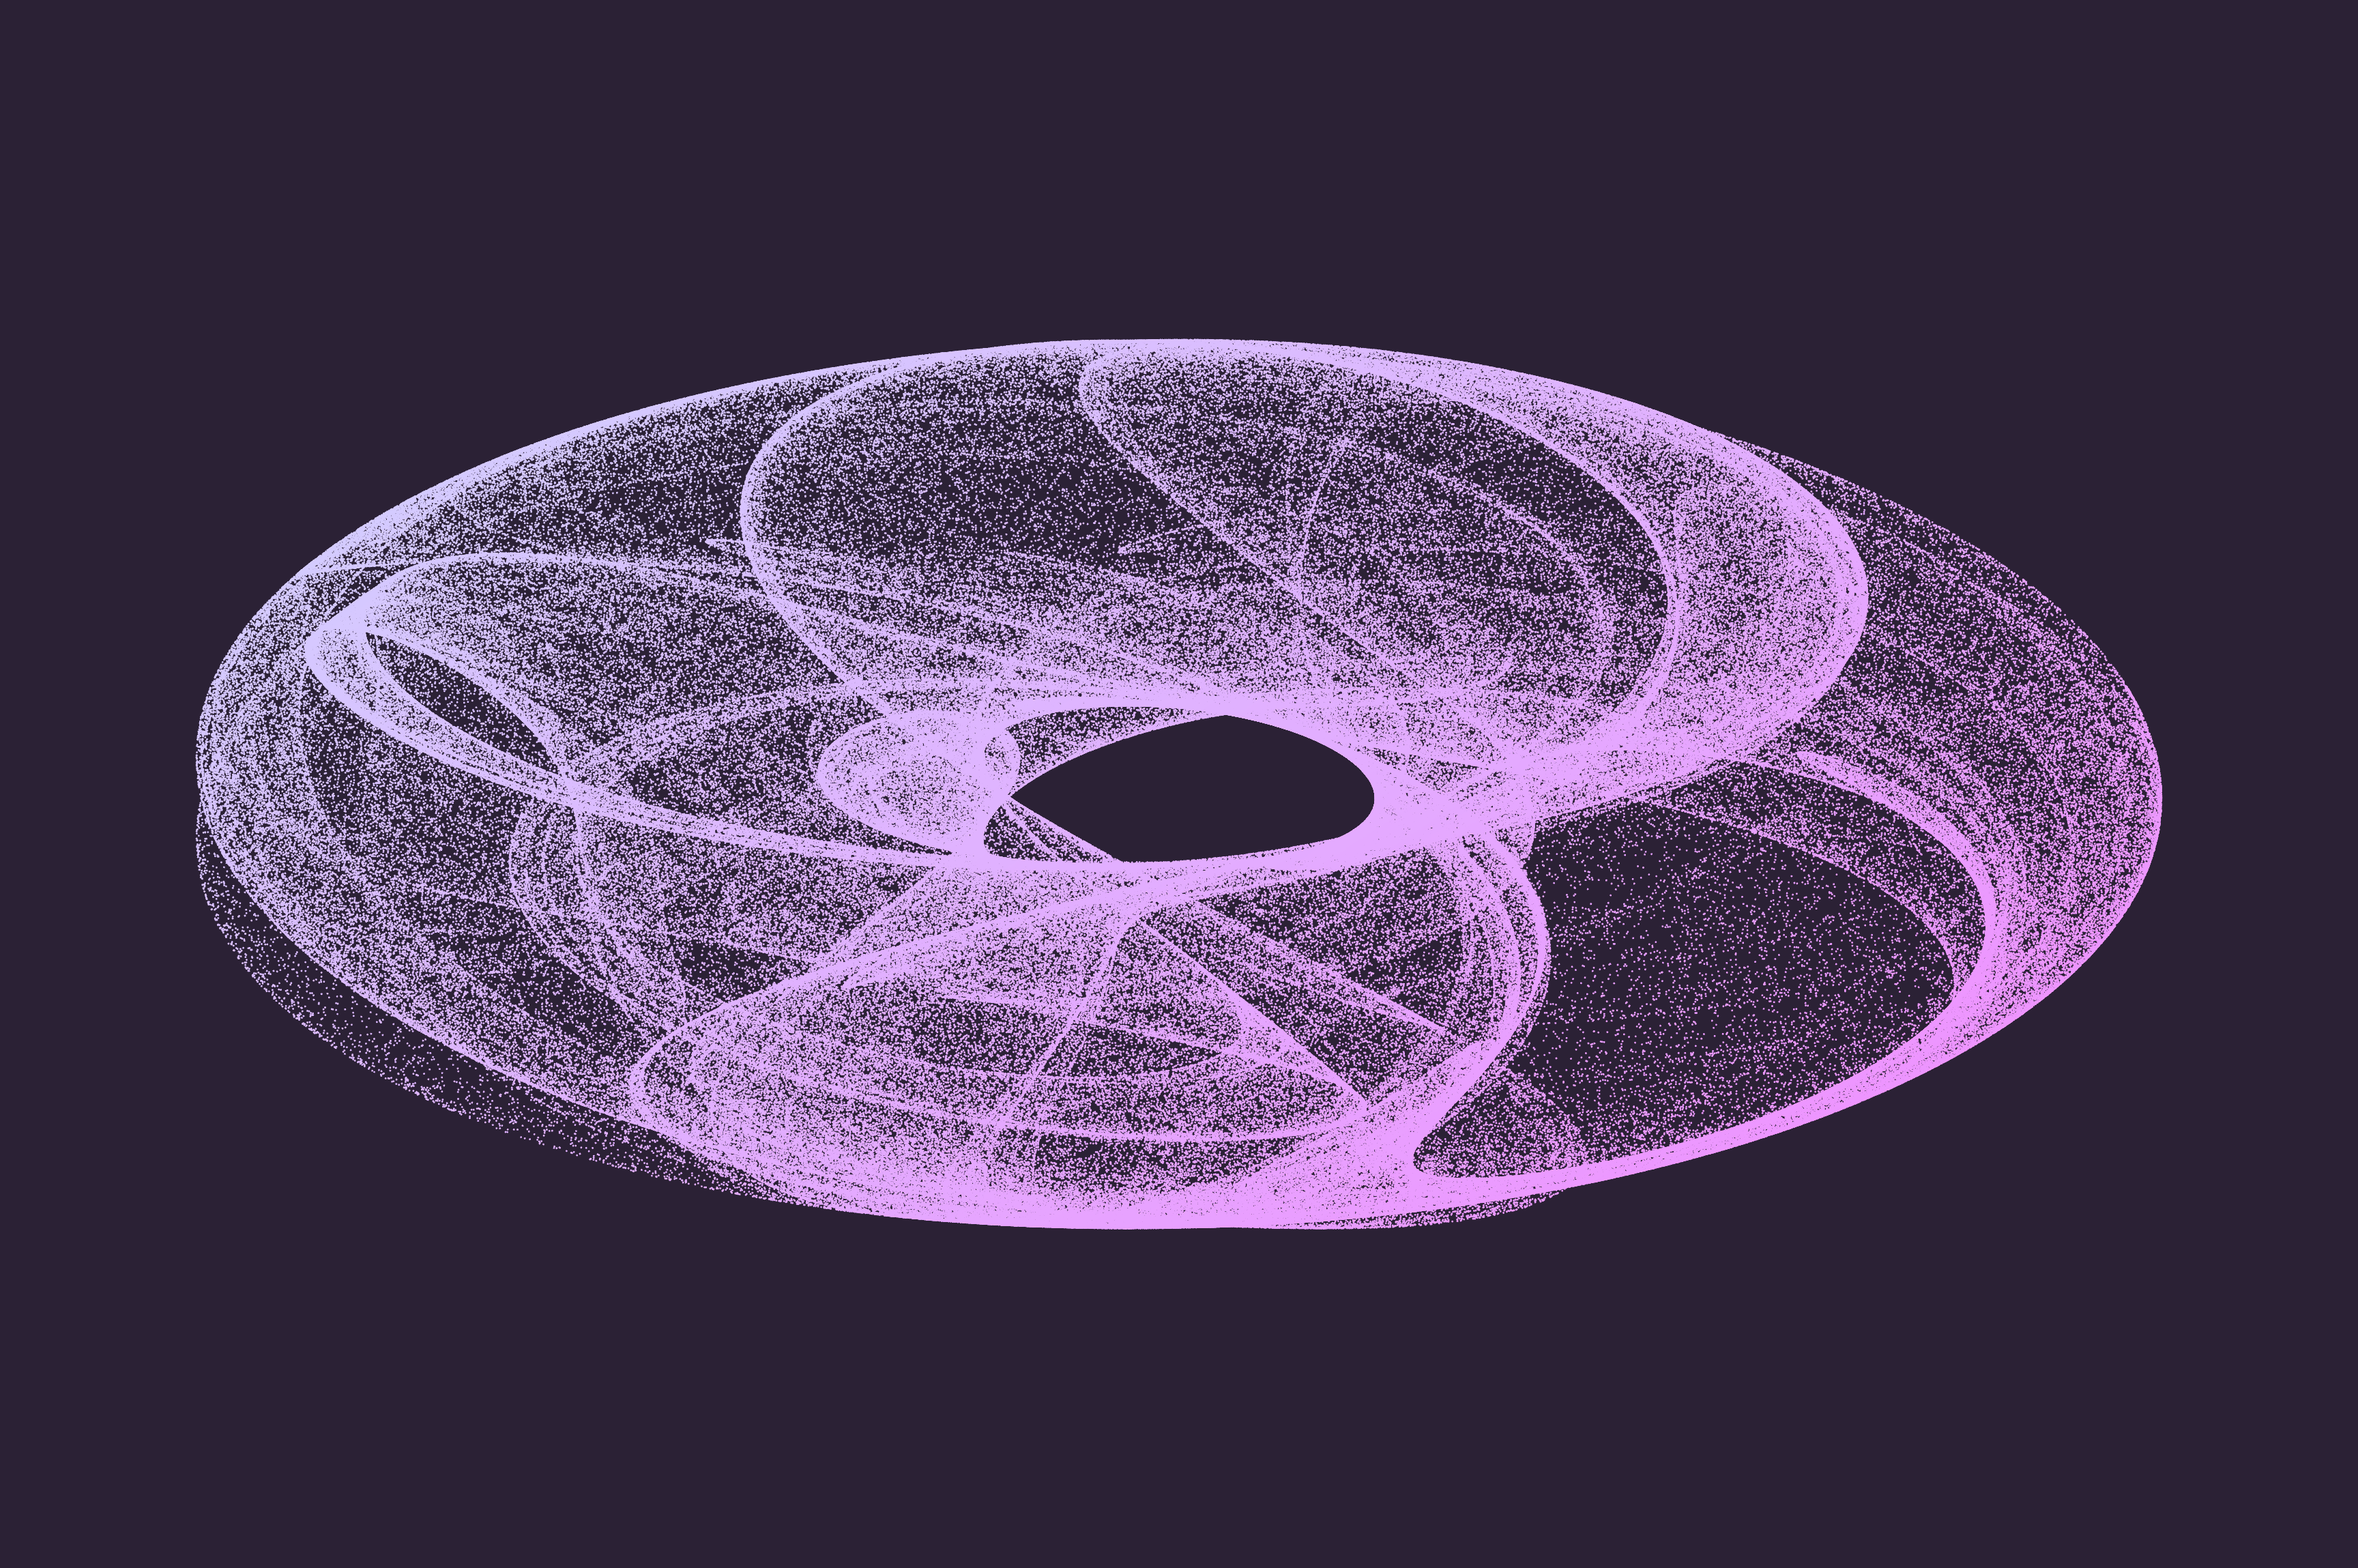
Creative coding has given me a better appreciation for how math can be used to generate visuals, like this donut-shaped Clifford Attractor I created earlier this year during #genuary.
This article focuses on lerpColor() which is one of my favorite creative coding techniques and p5⁎js
functions. It uses math to precisely compute the blended output of two colors.
What is Linear Interpolation?
Linear interpolation is a mathematical method used to “fill in the gaps” between two known data points. A straight line known as “linear interpolant” is created between the two data points and when given a desired position between the two that position is mapped to a value based on where it occurs in the straight line.

The above gradient is composed of ~200 rectangles that all have slightly different fill colors that seamlessly create a gradient when they’re aligned. Explore the associated p5⁎js code and play around with the gradient below 👇🏾:
Computing color based on position
The same approach of computing the fill color of shapes based on the x or column position is applied in the below gradient grid of irregular “squares” which uses lerpColor() to transition the colors from #9f86c0 to #e0b1cb based on the position of the current shape (computed by column/height).

// parameters for lerpColor
lerpColor(c1, c2, amt);
The p5⁎js lerpColor() requires 3 parameters, c1 which is the color it interpolates from , c2 which is the color it interpolates to and amt which should be a number between 0 and 1.
The general algorithm used to create the color distribution of the shapes based on their column:
-
loop through each the x, y position of each element
-
set fill color using lerpColor based on the current element’s column
-
draw shape to represent element
Now, let’s translate that into p5⁎js code.
The below code shows how we can compute the shape’s fill color value between #9f86c0 and #e0b1cb based on its position.
const from = color("#9f86c0"); // c1
const to = color("#e0b1cb"); // c2
const amt = column / height;

// changes fill color based
// on the position of the element

fill(lerpColor(from, to, amt));
In the below example, the value of column/height varies from 0.206 to 1.646 in this particular grid and we see different color values for each column as they each has a distinct column/height value and therefore maps to a different color value between #9f86c0 and #e0b1cb.
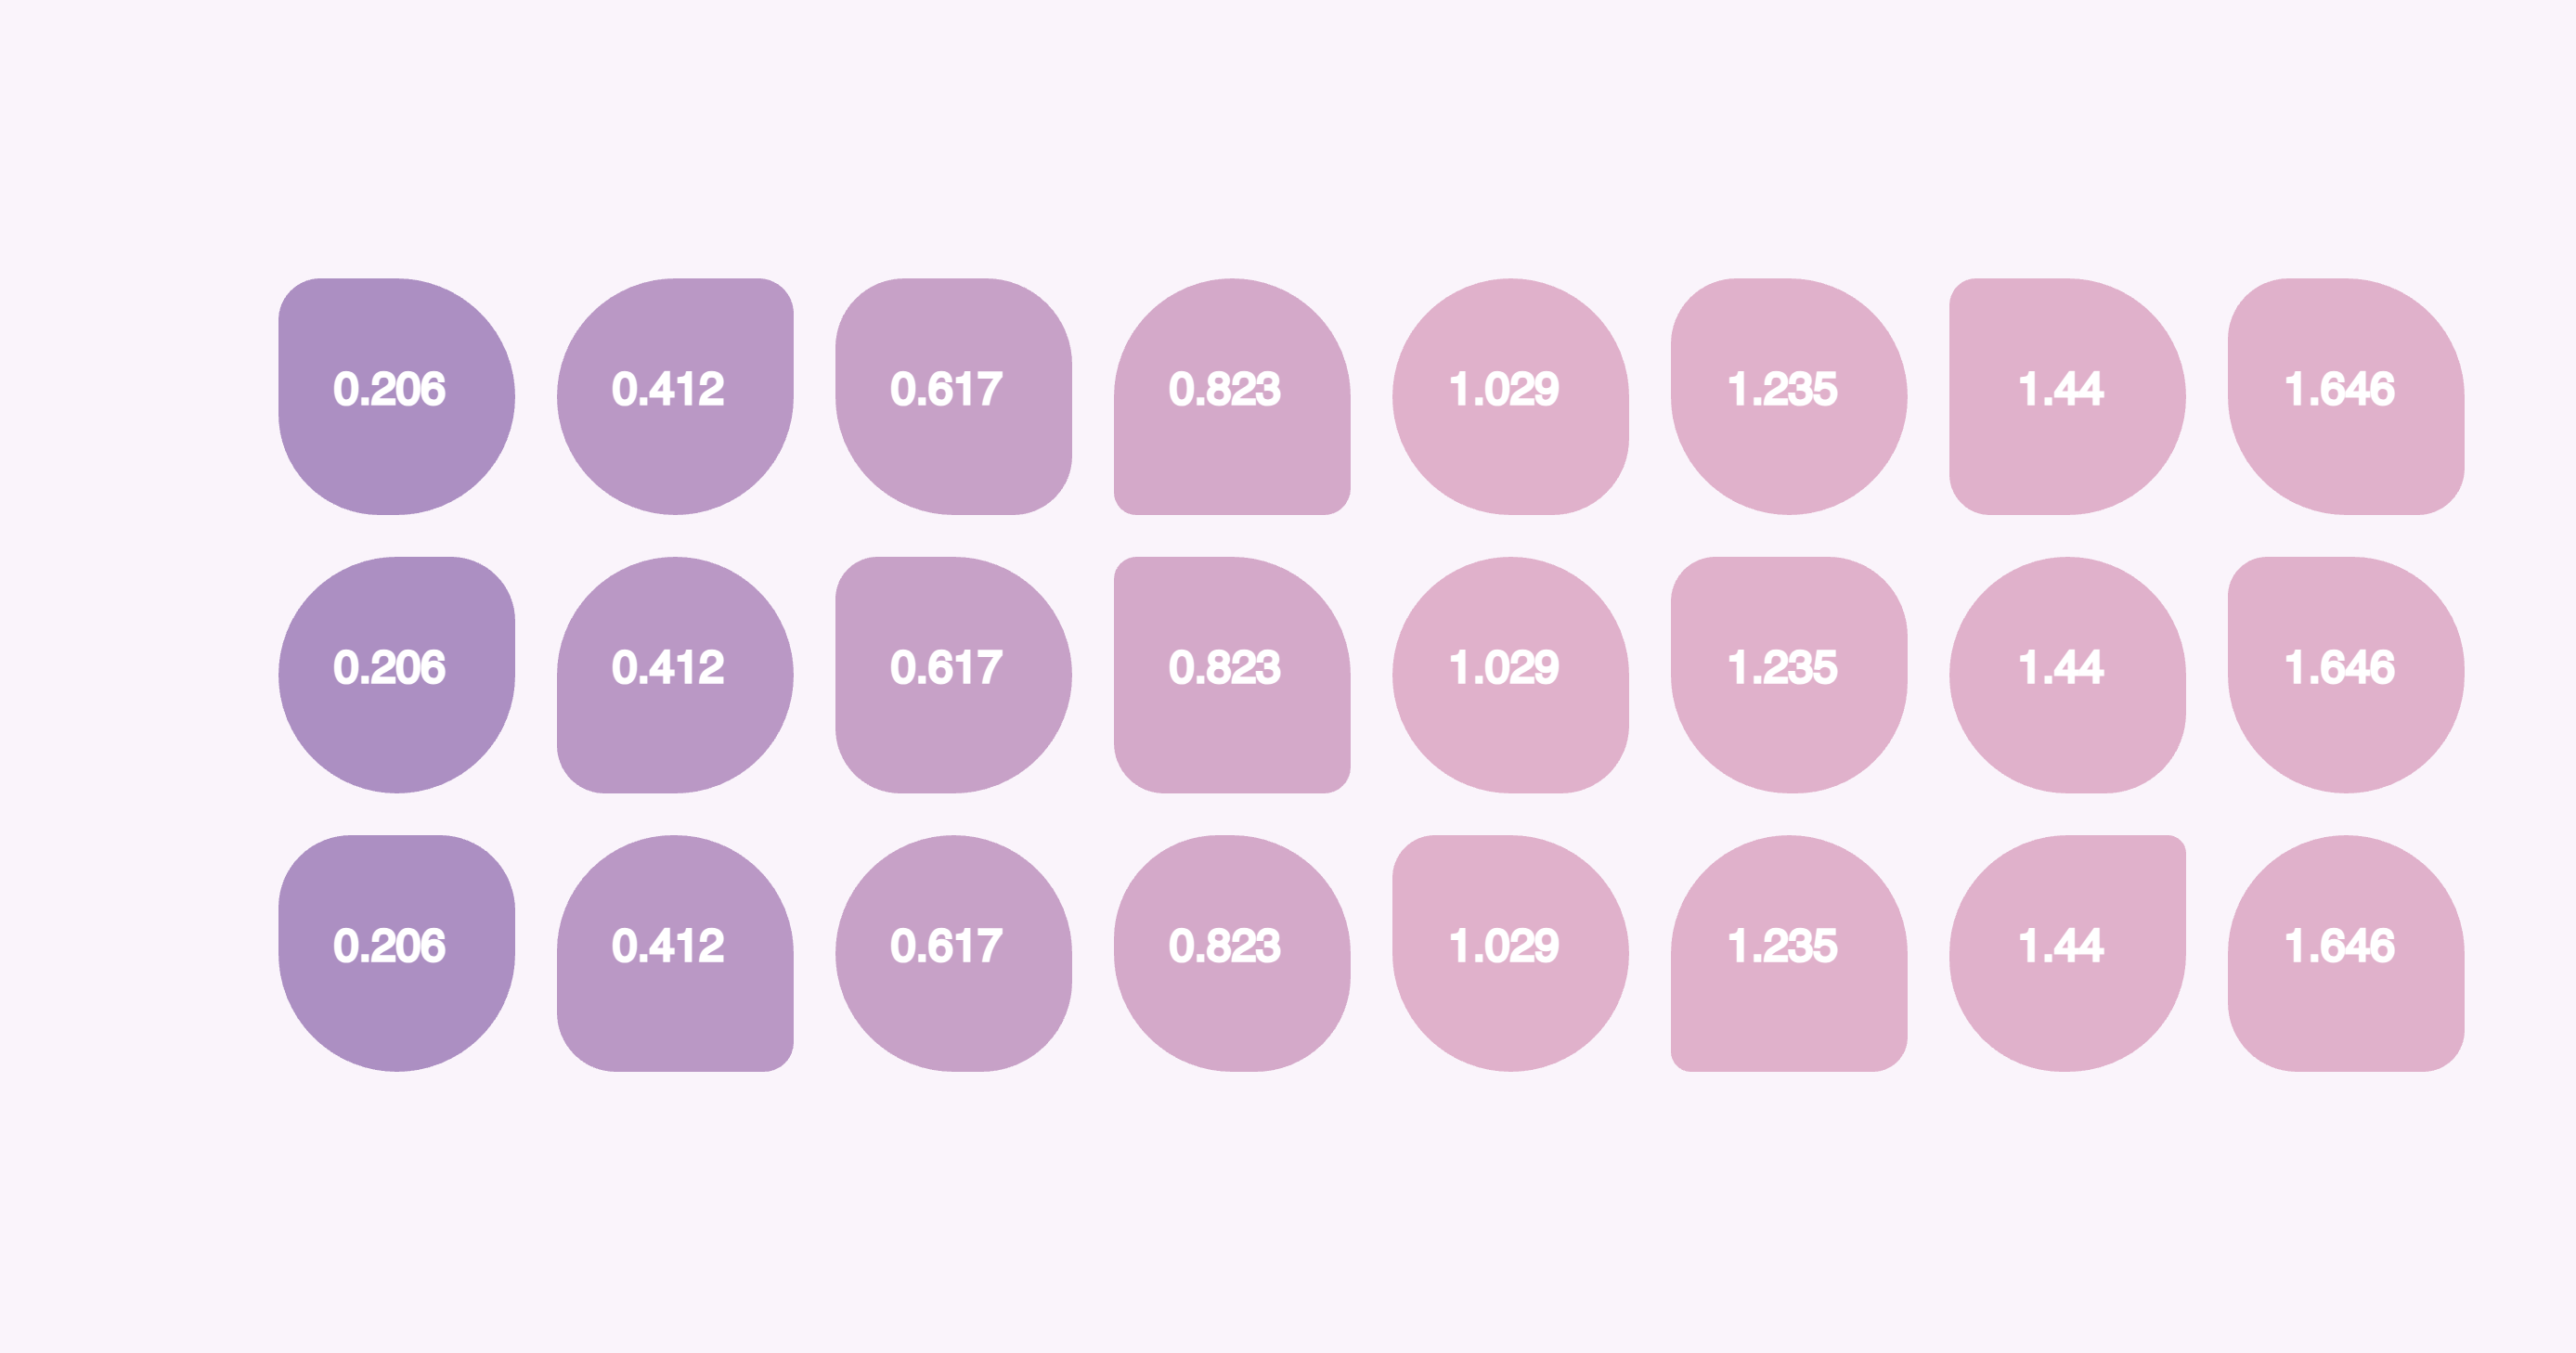
However, you may notice the latter half of the grid has 4 columns that appear to be the same color.
This is due to the fact that the computed value of the column/height is greater than 1 and when
you pass in a value less than 0 or greater than 1 then lerpColor() will normalize the value to the closest number between 0 and 1 in order to minimize strange results with the output color. This behavior is distinct from the similar lerp() function which is designed to be used with numbers and will compute values that are out of range of from it’s numerical start and stop parameters.
Explore the associated p5⁎js code and play around with the grid of shapes below 👇🏾:
Conclusion
Thanks for reading this article! I hope you learned something new about how linear interpolation can be applied to generating colors. I’d love to see what you create with lerpColor(). Feel free to share with me on Twitter.
 Follow @monica.dev


In addition to the Clifford Attractor formula, Paul Bourke has a whole collection of fractals, chaos, and attractors: paulbourke.net/fractals/