Peloton Data Visualization
I created this Data Visualization p5⁎js sketch after watching Patt Vira’s video tutorial on creating a Habit Tracker - Data Visualization. I really enjoyed watching the video and then creating this visualization with the p5.js library. I downloaded my Peloton workout data from 2024 and then formatted it into a CSV file that contains 3-columns one with the full date as well as two additional columns with the month and date where I completed at least one Peloton workout. The CSV file looks like this:
FullDate,month,date
2024-01-03,1,3
2024-01-06,1,6
According to the above CSV data my first Peloton workouts of 2024 were on January 3rd and January 6.
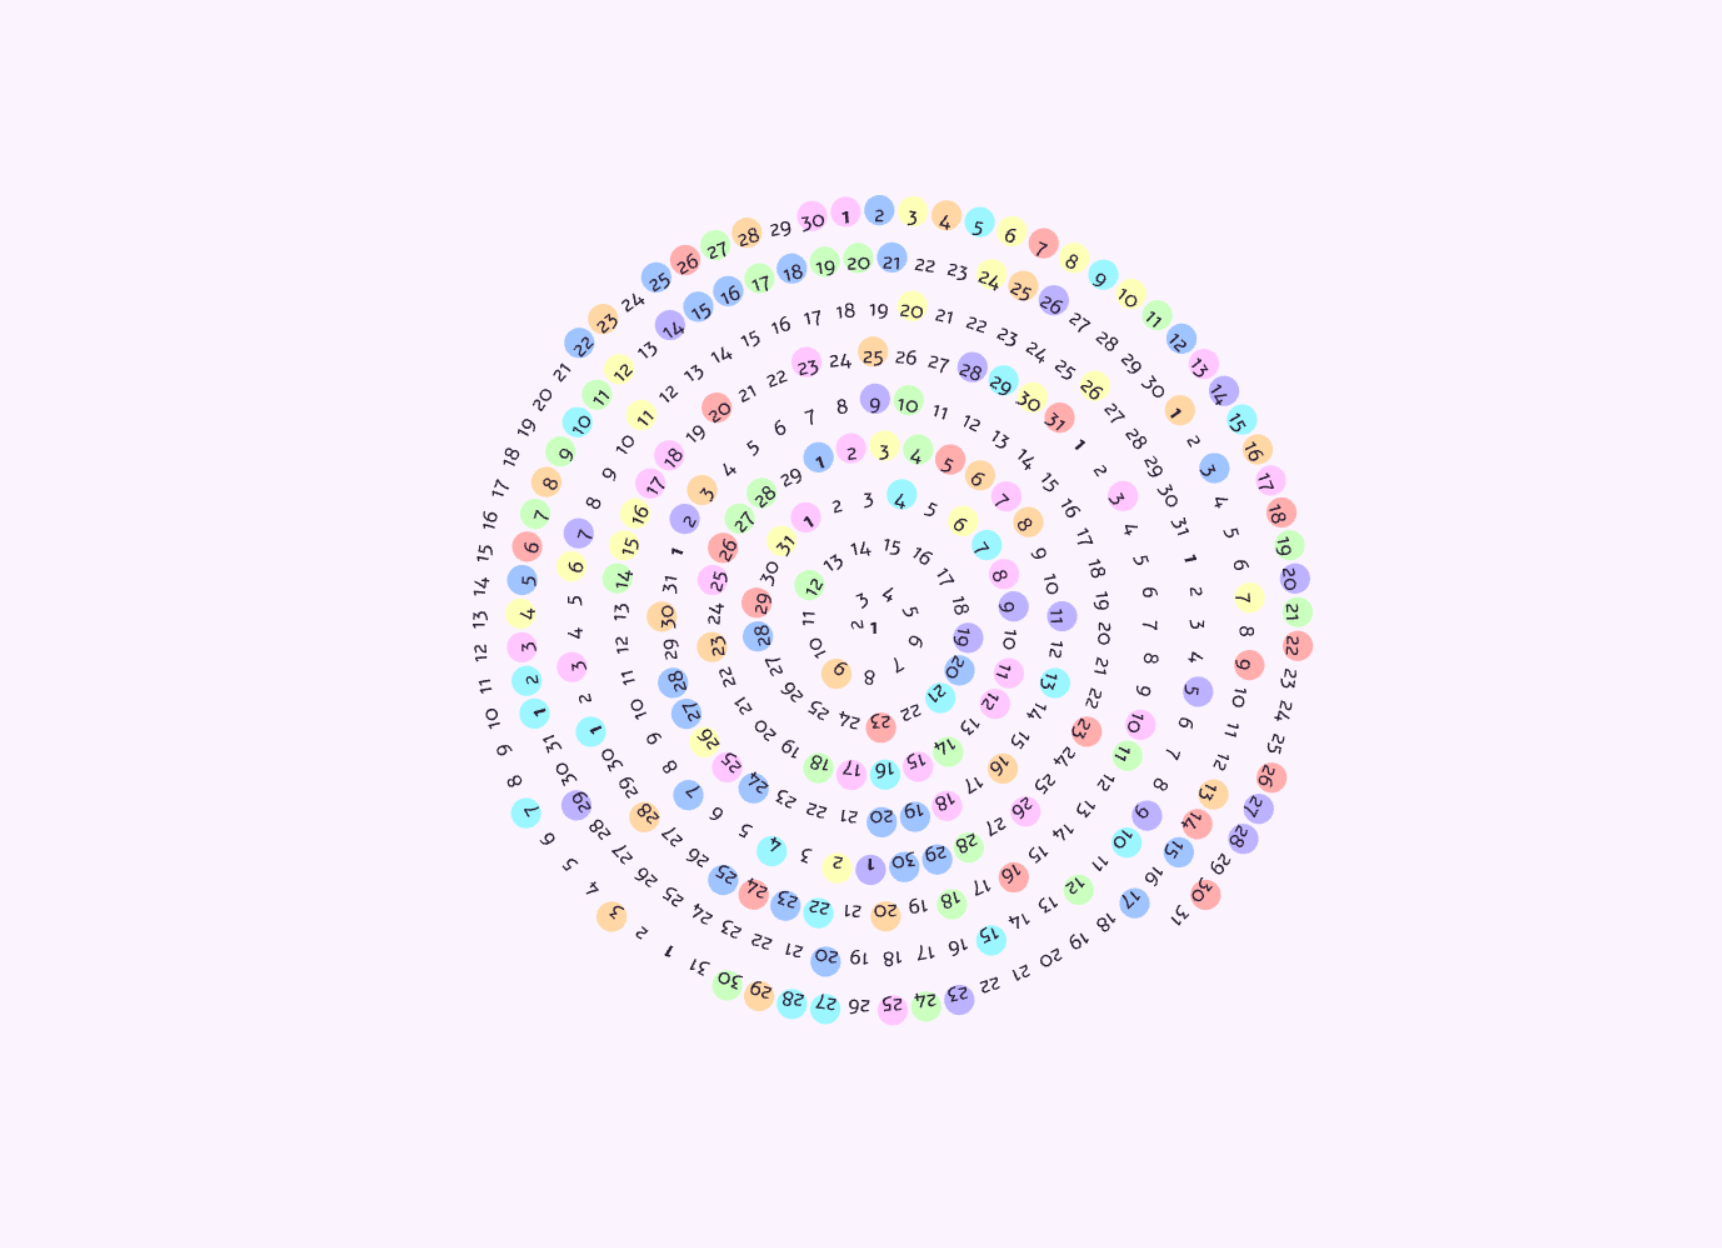
The visualization shows the dates in a circular pattern with the workouts as circles. The colors of the circles are randomly selected from a color palette. The visualization is a fun way to see the workouts over time. I’ve shared my code below but if you’d like a full walkthrough of how to create this visualization, I highly recommend watching Patt Vira’s video tutorial.
View p5⁎js sketch Source Code
/*
----- Coding Tutorial by Patt Vira -----
Name: Habit Tracker - Data Visualization
Video Tutorial: https://youtu.be/mQ4Cst7o4Ek

Connect with Patt: @pattvira
https://www.pattvira.com/
----------------------------------------
*/

let table;
let dates = [];
let months = [31, 29, 31, 30, 31, 30, 31, 31, 30, 31, 30, 31];
let runningDates = [];

let b = 3;
let size = 9;
let scl = 1.35;

const colorPalette = [
"#ffadad",
"#ffd6a5",
"#fdffb6",
"#caffbf",
"#9bf6ff",
"#a0c4ff",
"#bdb2ff",
"#ffc6ff",
];
let fontR, fontB;
let border = 15;

function preload() {
table = loadTable("PelotonWorkouts.csv", "csv", "header");
fontR = loadFont("Alef-Regular.ttf");
fontB = loadFont("Alef-Bold.ttf");
}

function setup() {
createCanvas(500, 500);

for (let i = 0; i < months.length; i++) {
  for (let j = 0; j < months[i]; j++) {
    dates.push({ month: i + 1, date: j + 1 });
  }
}

for (let row = 0; row < table.getRowCount(); row++) {
  let runningMonth = table.getNum(row, "month");
  let runningDate = table.getNum(row, "date");
  let didIRun = (element) =>
    element.month == runningMonth && element.date == runningDate;
  let index = dates.findIndex(didIRun);
  if (index != -1) {
    runningDates.push(index);
  }
}
}

function draw() {
background("#fbf4ff");
strokeWeight(0.5);
fill("#2b2135");
textAlign(CENTER, CENTER);
textSize(size * 2);
textFont(fontR);
text("Monica's Peloton Workouts", width / 2, height / 6);
fill("#bdb2ff");
textSize(size * 6);
textFont(fontB);
text("2024", width / 2, height / 16);
line(0, border, width, border);
line(0, height - border, width, height - border);
line(border, 0, border, height);
line(width - border, 0, width - border, height);

ellipseMode(CENTER);

translate(width / 2, (height + 50) / 2);
noStroke();
for (let i = 0; i < runningDates.length; i++) {
  let val = runningDates[i];
  let angle = sqrt(val) * b;
  let r = b * angle;
  let x = r * cos(angle);
  let y = r * sin(angle);

  fill(random(colorPalette));

  if (i > frameCount % 100) {
    console.log(frameCount);
    ellipse(x, y, size * scl, size * scl);
  }
}

textAlign(CENTER, CENTER);
textSize(size);
fill("#2b2135");
for (let i = 0; i < dates.length; i++) {
  let angle = sqrt(i) * b;
  let r = b * angle;
  let x = r * cos(angle);
  let y = r * sin(angle);

  if (dates[i].date == 1) {
    textFont(fontB);
  } else {
    textFont(fontR);
  }

  push();
  translate(x, y);
  if (i != 0) {
    rotate(angle + PI / 2);
  }

  text(dates[i].date, 0, 0);
  pop();
}

noLoop();
}

function keyPressed() {
const SPACEBAR = " ";

if (key === "s") {
  saveCanvas("workouts");
}
}